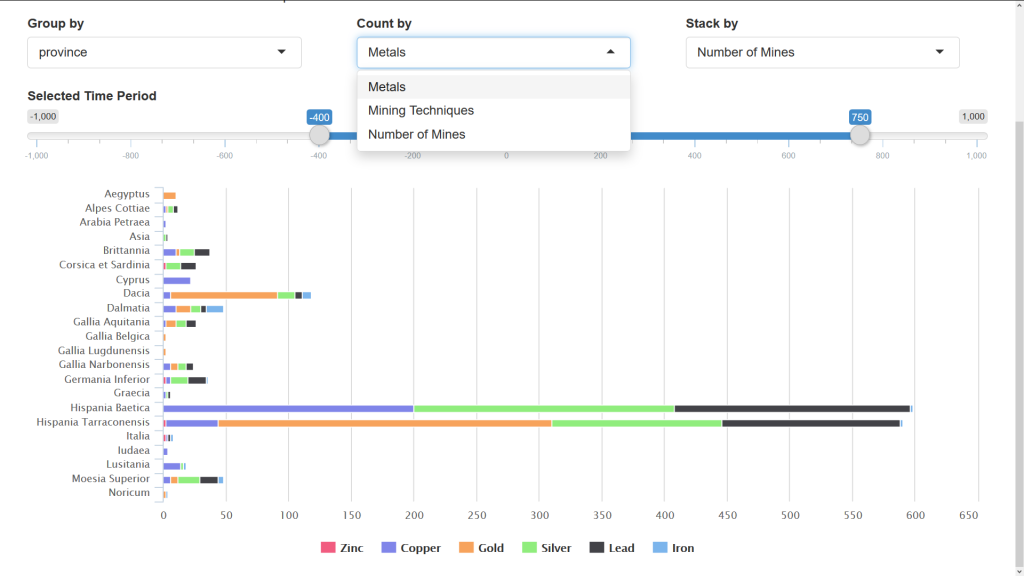
In coordination with IT Services and the Bodleian Libraries, this project will further the collaborations and services necessary to support researchers in publishing interactive visualizations of research data in OUP-published journals.
The project intends to: (a) identify between one and three Oxford-authored research articles that have been accepted for publication by OUP journals (b) liaise with the authors and Bodleian Libraries staff to host the underlying research dataset in an appropriate data repository (c) in coordination with Academic IT staff, provision the dataset through a third party data visualization service to create an engaging visualization, and (d) integrate the resulting interactive visualization alongside the published research articles on the OUP website.
The benefit to the reader is that it will allow them to manipulate and interact with “the data behind the graph,” increasing their engagement with, and understanding of, the published research.
For the author, it provides greater impact and educational value for their publication. The visualization will also be used to promote the author’s research through social media.
Data publication is considered to be the next frontier for research publishing. The benefit of this innovation project to researchers is that it allows both the Libraries and OUP to experiment in the publication of live and interactive research datasets.
Finally, the project will include a legal, technical, and commercial evaluation of the proposed data publication and visualization infrastructure.
The proposal is a clear demonstration of OUP’s mission to “further excellence in research through publishing.” It positions both OUP and the University to integrate data visualization services with the publication of research datasets and to offer a more valuable publication service to OUP authors.

