 The first Live Data Network event was hosted by the OeRC on Monday 16th November with presentations from nine researchers from across the University and introduced by Professor of Visualisation, Min Chen. An enthusiastic audience of 27 brought the room over capacity, evidence of the wide interest in building interactive visualisations at the University.
Talks were invited from researchers with existing visualisations or datasets they would like to visualise, and from the developers of specialist visualisation tools built here at Oxford.
- Dr. Alexandre Tessier (visiting the Faculty of History) discussed his study of Early-Modern European Mail services and his interest in visualising how the network developed and changed across the three centuries in his field of study. This project is part of the Cultures of Knowledge program.
- Marilou Polymeropoulou (Faculty of Music) presented on using networks and social network analysis (SNA) as a method for visualising data in the social sciences and humanities with amusing clips from the Europe in 8bits documentary accompanying her work on visualising the ethnography of 8bit music across the world.
- Rowan Wilson (IT Services) has a project to visualise data using Blender 3D and demonstrated the capabilities of Blender for photo-realistic rendering, rigging and animation.
- William Allen (Migration Observatory) provided an overview of how the Migration Observatory has used interactive visualisations to give the public a window into the 2011 Census.
- Daniel Haley (Materials Science) demonstrated the fascinating 3Depict software for visualising 3D point clouds, with integrated visualisations for charge/mass and spectroscopy data.
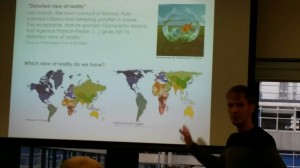
- Benjamin Hennig (Geography) is pictured top-right discussing his work with cartograms on http://worldmapper.org and http://londonmapper.org
- Ben Jeffery (Wellcome Trust Centre) works on the impressive Panoptes tool for exploring and visualising research data, with a particular focus on genomic data.
- Stephen Taylor (Computational Biology) gave an excellent overview of the Oxford developed Zegami tool for image collection categorisation with integrated analysis and visualisation tools.
- Andrew Stretton (ChemBioHub) is the web developer for ChemBioHub, building a platform for researchers to organise and collaborate on chemical biology research with built-in visualisation.
Note: In the interest of openness, Martin Hadley’s introductory presentation and the results of the cake survey are available through this Shiny app, https://martinjhnhadley.shinyapps.io/LiveDataSiG16thNov

Cake preferences for the Live Data SiG held on 16th November