One of the bits of work that we’ve been looking at is identifying useful information help within the Windows logs which we can utilise to help us see what is going on.
An example of this is looking using the Windows Diagnostics Performance logs. These are burred pretty deep in the menus and are not the easiest to find. When you do find them you then see what seem like a huge number of alarming looking entries classed as either critical or errors. These are a bit mis-leading as most of them are not referring to things that are not working which is different to say the standard System log – if you had a screen full of them in there then you know you’re in serious trouble.
If we filter this log on just Event ID 100 we get all errors associated with delays at boot, ID 101 gives is applications which are taking longer than usual to start up and ID 102 gives us any drivers that took too long to initialise. These are all measured against built in thresholds within the Windows source code and understanding all of the details is rather complex. However it does give us a baseline to pull information back from machines and compare them. An example of one of the ID 100 errors on my machine is below:
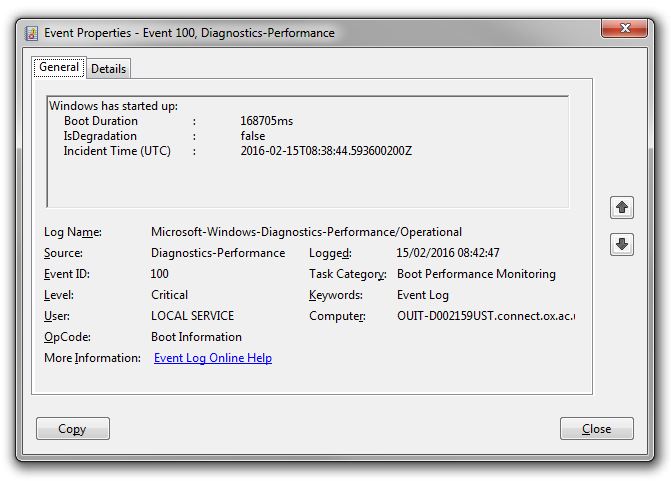
We will start gathering these entries from a sample of machines where we know we’ve had specific performance-related issues occurring. We’ll do this remotely on machines, with a script which will pull these locally into an Excel spreadsheet before emailing them back to us so we can collate the data. The majority of this is being done through PowerShell, with the below line an example of filtering and capturing the ID 100 logs as above.
![]()
Once we’ve done this we’ll be going through everything to find any common entries and also comparing it with our benchmarking.