3-month report: March to May 2015

Highlights

With the end of the ORDS early-life support project approaching the project team have been working hard to iron out bugs and set up the support and maintenance for the ongoing service. The service will be offered by research support (working with researchers), software solutions (will own code maintenance and development) and sysdev (management of servers) teams in IT Services. We aim to make ORDS an important tool in the research data management lifecycle i.e. for storing and developing databases during the ‘active’ phase of a research project, and facilitating the deposit to a preservation service such as ORA-Data. ORDS is currently free for early adopters but in future we will need to ask researchers to add a cost line item to their research grants. It will therefore be important for us to continue working closely with the Bodliean Libraries and Research Services.

We’ve been advising the BRISSKit project based within the University of Leicester. BRISSKit is an open source software platform for conducting biomedical research. It is deployable either locally or in the cloud and it enables biomedical and translational researchers to securely manage and combine datasets. BRISSKit grew from funding provided by JISC and HEFCE, and is now a strategic project for the newly reformed Jisc, and will likely make use of the Jisc Shared Data Centre.

The OxGAME project has now been transitioned to the Shallows Seas project and we will watch and learn how Unity can be used to in active research projects i.e. as a novel approach to interviewing and questionnaires. There are already a number of academics at Oxford interested in exploring this technology at the Geography department.

We’ve worked FrontRange HEAT into our processes and are learning how to use this to coordinate our work with other teams in IT services.

We also hosted Rupert another local work experience student.

Progress against plans for last 3 months

Engagement statistics, March to May 2015

Engagement statistics, March to May 2015

  1. Service transition for ORDS is on track
  2. Live data PID completed and funded by the Research IT board
  3. FR Heat embedded in our MO
  4. Blender 3D proposal submitted to the Innovation fund
  5. Research data documentary film still underway

Plans for next 3 months

  1. Ensure we have met our budget target
  2. Finish ORDS ELS
  3. Finish this year’s Clarin Eric and Clarin OeRC engagement
  4. Publish research data video to iTunesU and podcasts.ox.ac.uk along with other talks filmed as part of ‘things to do with data’ and ‘data visualization’ talks
  5. Welcome our new recruit
  6. Setup closer working practices with the Bodliean Libraries
  7. Enjoy annual leave
Posted in Reports | Comments Off on 3-month report: March to May 2015

Trying Apereo OAE in Oxford


Apereo OAE (Open Academic Environment) is an online collaborative tool for universities. It sprang from development of the virtual learning environment Sakai, which is the solution underlying Oxford’s VLE instance WebLearn. OAE is a more free-form, peer-to-peer online environment that Sakai, by necessity. It encourages informal collaboration and brainstorming. Documents can be shared and collaboratively edited within the system, and teams of users built dynamically to share resources. It’s the kind of place that you might throw up a partially completed project bid and invite a group to comment and collaborate.

Oxford has access to a trial instance of OAE and anyone with an Oxford SSO account can log in and use it right now. There is also a mailing list for people trying the system out.

OAE is an interesting tool in that it is useful within a single institution, but its usefulness is multiplied as more and more institutions take it up. It is a piece of free/open source software, so anyone can run their own instance of it locally, but it is also provided as a hosted service, in which institutions can co-exist with their peers, and collaborations between academics at differing institutions can be constructed.

Our team is investigating the possibilities of this tool by making it available to Oxford staff and academics, and seeing what happens. We would be very interested to hear of use cases that this solution might support, and also those it might not. Have a go, and let us know!

Posted in News | 2 Comments

3-month report: December to February 2015

Highlights

ORDS title card with border

Click image to watch the new ORDS video (on YouTube).

Another great quarter for actively engaging the researchers: the Things to do with data, Data visualization and Corpus Linguistics seminar series, training in using ORDS, XML editing with Oxygen, the TEI Guidelines, XPath Searching,  agent-based modelling, and a new 3-hour practical course about using Blender for visualization. We have also delivered RDM training for the social sciences, MPLS, and Humanities divisions, for the NERC doctoral training programme, and via ITLP.

The IT Services ORDS early-life support team is approaching the final stages in terms of fixing bugs and formalising the application management with the software solutions and infrastructure teams. We also released a new ORDS demo video.

The IT Services Redds project has started to scope and specify the deposit interface to ORA Data.

Mark Johnson is a web developer, data wrangler and open source software specialist. Contact mark.johnson@it.ox.ac.uk

Sadly, Mark Johnson left IT Services to join the Open University

The IT Services lecture capture project has started where we will lead on evaluating alternative software for recording and sharing presentations.

The EU VALS project is in the final phase and our contribution will be focused on evaluation and recommendations.

The IT Services Web CMS project is up and running again and we are leading the definition of user requirements and piloting templates with researchers.

The EU DiXiT project has delivered a number of training events across Europe.

We continue to contribute to the CLARIN ERIC network focusing on user involvement in language resources and tools, and to contribute to the setting up of a UK consortium of research institutions aiming to develop infrastructure for sharing digital linguistic data and tools.

We are providing IP expertise to the Jisc Brisskit project team.

We have begun the IT Services Live data to scope a set of data visualization services.

We have been given the go-ahead to investigate how to better support research who need to manage participant data (IT Services Participant Data project will start Sep 2015).

Sadly we had to say goodbye to Mark Johnson who has joined the Open University. Mark made an enormous contribution to the team over the last 3 years working on ORDS, developing Drupal, leading on open source advice and starring in several vodcasts. We saw Mark off at the local with a few games of DiXit (yes, he won) and Ergo (designed by Brian and Brent Knudson) – possible the nerdiest game ever invented.

Progress against plans for last 3 months

Engagement statistics, December to February 2015

Engagement statistics, December to February 2015

  1. Plans are still in formation regarding how we will report to the research IT committee (with the libraries and other service owners).
  2. We have agreed to drop the application for funding for the OxLangCloud project and instead support a pilot of the CQPweb software run by OeRC and Linguistics faculty
  3. We have started the Live Data project and been given the go ahead to run a project focused on participant data

Plans for next 3 months

  1. Hand over ORDS software maintenance to Software Solutions
  2. Finish the Live Data project PID
  3. Embed the FrontRange system in our team practices
  4. Write an innovation fund project focused on visualization of large data sets
  5. Finish a new documentary style video about research data and update the openspires website
Posted in Reports | Comments Off on 3-month report: December to February 2015

A Force to be reckoned with

Force2015 logoOn Monday and Tuesday of this week (12th-13th January) I attended the Force2015 conference on research communications and e-scholarship. The conference was the successor to two US-based events entitled ‘Beyond the PDF’ – but happily for me, Force2015 was handily located in Oxford, in a venue about five minutes’ walk from my office.

A major aim of the conference was to bring together people from a wide range of different sectors – researchers, publishers, funders, librarians, and more – so as one might expect, the programme covered a wide range of topics. Chris Lintott’s fascinating keynote on citizen science got things off to a strong start, but for me the most interesting discussion happened in the latter part of Tuesday morning, when there was a vision session (a series of flash talks where conference attendees had five minutes to present their idea for improving scholarly communication), followed by a panel session on academic credit.

Although these two sessions started from somewhat different perspectives, a common theme very rapidly emerged: that the way in which the outcomes of research are presented and assessed needs to change. The primary unit of academic communication (and the thing that matters most in terms of CV points for researchers) is still the traditionally published journal article. However, text-based articles aren’t the only result of scholarly endeavour, and we need to find new ways of enabling other research outputs – data, software, multimedia objects, and more – to become part of the formal research record. Alongside that, we need to rethink the way in which researchers are credited for the work they do (composing the actual text of an article is only one part of the scholarly process), and the value that is placed on each role. This echoes much of what the research data management community has been saying for some years now, though with an even broader scope – I hadn’t, for example, previously fully appreciated the importance of software as a research output in some fields.

However, while there was much useful debate, I was personally rather disappointed that non-science disciplines weren’t better represented, both here and elsewhere on the program. Social sciences popped up occasionally, but all too many of the sessions barely even acknowledged that the humanities existed. For a conference about the future of research communications to argue that the current model of scientific publishing doesn’t represent how research in that field actually works is entirely legitimate and much needed. But for much discussion at the same conference to proceed as if scientific research were the only sort that takes place is more than a little worrying.

At one point things almost seemed to be veering in the direction of claiming that papers weren’t really important at all, or that they were merely advertising for the real content. A question from the audience drawing attention to this produced some hasty backtracking, and assurances that the significance of the interpretation and conclusions provided by the text wasn’t being overlooked. Nevertheless, I couldn’t help feeling that the whole shape of the discussion might have been different if there’d been someone on the panel putting the perspective of the philosopher or the historian. (We were told a couple of times that Force11, the organization behind the conference, is making an effort to be more inclusive and to cover a wider range of disciplinary views: we can only hope that these labours will have borne more fruit by the time Force2016 rolls around.)

On a more positive note, I was at the conference with my Online Research Database Service (ORDS) hat on, with a poster and an accompanying demo. It was good to have the opportunity to show the system off to a group of interested people, and pleasing to get some excited responses. A major part of the reason for developing ORDS was to provide researchers with a straightforward way of sharing their data, both with collaborators and with the public, with a view to allowing the data to be recognized as a key resource in its own right – so it’s nice to feel we’re doing our bit to help bring about a revolution in scholarly communication.

Posted in Events | Comments Off on A Force to be reckoned with

Is your software open or fauxpen?


Is your software project open or “fauxpen”? Are there barriers in place preventing external developers from contributing? Barriers to commercial uptake? Barriers to understanding how the software or the project itself works?

These are the kind of questions that the OSS Watch team, in partnership with Pia Waugh, developed the Openness Rating to help you find out.

Using a series of questions covering legal issues, governance, standards, knowledge sharing and market access, the tool helps you to identify potential problem areas for users, contributors and partners.

We’ve used the Openness Rating at OSS Watch for several years as a key part of our consultancy work, but this is the first time we’ve made the app itself open for anyone to use.

It requires a fair bit of knowledge to get the most out of it, but even at a basic level its useful for highlighting questions that a project needs to be able to answer. If you have a software project developed within your research group, then you can use the app to get an idea of where the barriers might be. Likewise, you can use it if you’re considering contributing to a software project, for example when evaluating a platform to use as the basis of work in a research project.

Some of the questions do require a bit more specialist knowledge, but you can contact our team via email at researchsupport@it.ox.ac.uk to get help.

Get started with the Openness Rating tool.

Photo by Alan Levine used under CC-BY-SA.

Posted in Software sustainability | Comments Off on Is your software open or fauxpen?

Data Visualisation Talks

This information is now available here.

Posted in Data visualisation, Events | 1 Comment

3-month report: September to November 2014

Highlights 

As part of the DiXiT project our ER, Magdalena Turska, has been working with the TEI Consortium’s Mellon-funded TEI Simple project. Her work has involved the migration of the reference corpora into the TEI Simple tagset as well as prototyping an implementation of the TEI Simple Processing Model. The latter she presented at the TEI Conference in Chicago. The TEI Simple Processing Model aims to allow general specification of intended processing scenarios targeting multiple output formats by using extensions to the TEI ODD customisation language. Magdalena also travelled to Romania spending a week at the headquarters of DiXiT partner SyncRo Soft SRL implementing some additional features to the oXygen XML Editor’s TEI framework. Magdalena will be returning to Romania for a longer period in 2015. She also took the lead in organising and teaching an ‘Introduction to TEI’ workshop, assisted by James Cummings, on behalf of DiXiT in Warsaw in October that was very well received and resulted in a number of potential future partnerships. Upcoming plans for Oxford’s contributions to the DiXiT project include the analysis and publications of the results of Magdalena’s survey of publication infrastructures, continued implementation of the TEI Simple Processing Model, and preparation for DiXiT Camp 3 to be held in February in Borås, Sweden where she will again be doing some additional teaching.

Luke Norris, Ken Kahn and the fishing prototype created using the MIT app inventor

Luke Norris, Ken Kahn and the fishing prototype created using the MIT app inventor

ORDS ELS Update 1.0.6 has been released and fixes a number of software bugs. There are ten full research projects and 14 trial projects in the system at the moment, which is good progress towards the target of 20 full projects by September 2015.

The Things to do with data series is running again and we will soon release recordings of these talks online.

The Lecture capture project was funded and we will deliver a work package that will evaluate current solutions i.e. for recording and sharing lectures in a way that people can attend remotely and the footage can be shared afterwards with voice matched up with presentation slides.

The Oxford Innovation platform was launched for IT Services, Libraries and Museum staff. Our team contributed many ideas and comments and we look forward to finding out which are funded.

Luke Norris completed his 1 week work experience placement from Woodgreen school in Witney. Luke has already decided he wants to be a game programmer. Luke investigated tools for creating a game that fisherman (and other stakeholders) would play to design a common pool resource institition (aka sustainable fishing in light of climate change and the bleaching of coral reef that is happening very rapidly all around the world). Luke is 15 and in the last year of his GCSEs.

Progress against plans for last 3 months

Engagement statistics, September to November 2014

Engagement statistics, September to November 2014

  1. Meriel is leading our communications plan and we have requested a series of changes to the research support page on the IT Services website.
  2. The ORDS early life support project is underway and the team have just submitted release 1.0.6. We have also initiated the process to handover application ownership to the software solutions team.There are currently ten projects in the system.
  3. Current projects:
    1. VALS is a project that aims to provide “virtual placements” for computing students where they work with mentors on open source projects. So far 64 open source organisations have contributed 237 potential placements.
    2. WebCMS project has been put on hold until January 2015 but we are supporting the project by conducting requirements gathering and analysis exercises.
    3. DiXiT is a 3 year Marie Curie ITN where Oxford is employing Magdalena Turska for 20 months to look at scholarly digital edition publication infrastructure.
  4. We submitted the following project proposals to the research committee:
    1. OxLangCloud would provide online access for research purposes to members of the University, as well as authenticated and authorized users from other HEIs, to the large and growing number of textual resources managed by the
      University.
    2. Live Data would create a pilot data visualisation service for the research community at Oxford. The project will demonstrate how data sets can be visualised to promote public understanding of research.
    3. Participant Data would investigate how we can support academic researchers who need to maintain a database of participant details e.g. in order to conduct longitudinal social science studies, invite people in for psychology experiments or conduct vaccinatation trials.
    4. Redds would scope a deposit process for archiving databases created in ORDS
  5. We’re waiting to find out our role on the StaaS project i.e. supporting the selection of a tool that would make it easy for researchers to store data
  6. We decided not to look into whole lab RDM solution at this stage, and we have instead decided to focus on a project with software solutions that would deliver a coherant set of webservices for support research requests, with a particularl eye on more advanced requests e.g. making research data sets available for search, browse and visualisation.
  7. The communications plan is set up and we are submitting articles regularly e.g. to the medical sciences newsletter and IT Services communications
  8. We have not been able to implement the changes we need to make to the IT Services website because of the recent severe security issues that have hit Drupal instances.
  9. We ran a 3 hour meeting with service teams across IT Services who provide support for research i.e. research support, ITLP, software solutions, ARC team. The main outcomes are:
    1. Research support team to setup and implement a single point of contact for researchers and ensure that IT Services offers a high quality advice, support and guidance service for researchers who request IT-related advice.
    2. To change the research support page on the IT Services website to reflect the full range of services we provide i.e. ARC, ITLP, Crowdsourcing, Software Selection,

Plans for next 3 months

  1. Update research support service reporting based on what is requested by the Research Committee
  2. Deliver or continue ongoing projects: ORDS ELS, VALS, WebCMS, DiXiT
  3. Start new projects if funded i.e. OxLangCloud, Live Data, Participant data and Redds
  4. Plan our work on the lecture capture project that has just received funding
  5. Create a new wall of faces page within the Openspires site to feature researchers interested in the openness agenda, and create a new documentary style video focused on research data at Oxford.
Posted in Reports | Comments Off on 3-month report: September to November 2014

Where do Oxford researchers manage the source code for their software?

I’ve been taking a look around lately at the various places where researchers are keeping the source code for their software.

Its not an exhaustive survey by any means (though maybe we should do one of those), but it seems that there are two common options.

Octocat - the mascot of Github

Github is, as you would expect, a very popular place to host source code. Here you can find the Micron Oxford Bioimaging Unit, for example, the Oxford Clinical Trials Unit, and the Oxford Internet Institute. Its also where IT Services hosts its own open source projects. Even the New College JCR has its own space on Github!

GitHub is a good choice given its well known, has good supporting services such as issue tracking and website hosting, and lets you register an organisation as the owner of multiple projects. It also allows a small number of private repositories for free as well as unlimited public repositories.

The gitlab mascot

However, for research groups that need to manage private code repositories, or want to host the code locally, GitLab seems to be a popular option. GitLab provides many of the supporting services that you find on GitHub, such as issue tracking, but can be hosted locally with no limit on the number of private repositories, and can even be integrated with other services such as LDAP. You can find GitLab installations at Oxford in Mathematics, at the FMRIB, and the Bodleian.

Subversion logo

There are also a few Subversion repositories around; we use one in IT Services for managing our websites (among other things), and there’s one in Computer Science. Given that these are primarily for internal use I suspect there are quite a few more out there we aren’t aware of.

If you’d like help choosing where to host software source code for your research group, send us an email at researchsupport@it.ox.ac.uk

Posted in Software sustainability | Comments Off on Where do Oxford researchers manage the source code for their software?

How to: create a bubble chart from a Google Spreadsheet using D3.js

Earlier in this series I discussed how to get data out of a Google Spreadsheet in JSON format using an API call, and how to convert the JSON data into an array. Now I’m going to talk about how to visualise the data as a bubble chart on a web page, using the fantastically powerful JavaScript library D3.js, aka Data Driven Documents.

For this exercise I’ve created a Google Spreadsheet representing some information about a fictional group of people with a count of their interactions. You can see the spreadsheet here.

Following the instructions in the previous How To guides we can get this data using JSONP; you can see the result for yourself here.

So, having got the source data, how are we going to visualise it?

Well, the first step is to transform the data once again into a structure that is more suitable for the D3.js techniques we want to use. In this case we’re creating a bubble chart using a method called d3.layout.pack(). This takes a tree structure of objects, and fits them into a volume based on the value property of each leaf node. In our example, the value we’re interested in is the number of interactions – so team members with more interactions will be represented by larger bubbles within the visualisation.

So how do we do that? Well, the easiest approach is to iterate over each row in the data, and create an object for it with a name, a value and a group. (The group property in this case is the team the person belongs to.) These “leaf” objects can then be added to a “root” object to make a tree in JavaScript.

The code for this looks like so:

    var root = {};
    root.name = "Interactions";
    root.children = new Array();
    for (i=0;i<dataframe.length;i++){
      var item = {};
      item.name = dataframe[i][0];
      item.value = Number(dataframe[i][1]);
      item.group = dataframe[i][2];
      root.children.push(item);
    }

So, taking it one line at a time – we create a root object, give it a name, and create a new empty array inside it called children. We then we go through each row in the dataframe and create an item object for each one, mapping the name, value and group properties to the correct columns in the spreadsheet. Each item is added to the children array.

We now have a tree of objects, each of which has a name, a value and  a group.

How do we create a nice-looking bubble chart with them?

First we set up the d3.layout.pack function so it can calculate the size and position of the bubbles. We do this using:

var bubble = d3.layout.pack().sort(null).size([960,960]).padding(1.5);

If you were to now call …

bubble.nodes(root)

… and take a look at the output, you would see each “leaf” object  now has several new properties for “x”, “y” and “r”. The “x” and “y” properties are where within the chart to position the bubble, for the object and the “r” property is the radius of the bubble.

(How this is actually drawn is up to you – you could equally well take this information and draw the whole thing using hexagons or squares or spheres. But lets stick to circles for now.)

Next we need to create a graphic for the chart in our HTML page. D3 can make this for us like so:

    var svg = d3.select("body")
                .append("svg")
                .attr("width",960)
                .attr("height", 960)
                .attr("class","bubble");

For each “leaf” we then need to create a graphical element. D3.js uses a very clever approach for this:


    var node = svg.selectAll(".node")
                  .data(bubble.nodes(root)
                  .filter(function(d){ return !d.children;}))
                  .enter()
                  .append("g")
                  .attr("class","node")
                  .attr("transform", function(d) { return "translate(" + d.x + "," + d.y + ")"; });

The key thing here is the data() method. We pass this the bubble layout we created earlier, and ask it to create the nodes based on our root object. (We also filter out the root node itself as we’re not interested in drawing that, just the individual leaf nodes.) The enter() method is then called for each leaf node in the tree, which appends a <g> element to the <svg> element in our HTML document, and applies the transform property to it to place it at the correct x and y coordinates within the chart.

This still doesn’t draw anything interesting, so lets make some circles for each node, and give them a label:

   var colour = d3.scale.category10();
   node.append("circle")
       .attr("r", function(d) { return d.r; })
       .style("fill", function(d) { return colour(d.group); });
   node.append("text")
       .attr("dy", ".3em")
       .style("text-anchor", "middle")
       .text(function(d) { return d.name; });

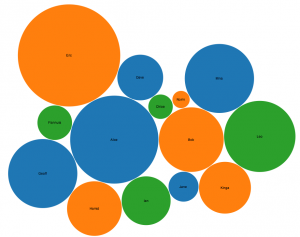
The result of all this is a nice diagram! Click to view it full size; you can also see the live version here.

A bubble chart

The complete source code for this How To guide can be found on Github.

If you’d like to know more about data visualisation, you can get in touch with us at researchsupport@it.ox.ac.uk.

Posted in Data modelling and migration | 1 Comment

How to: convert Google Spreadsheet JSON data into a simple two-dimensional array

In a previous post I explained how to extract JSON data from a Google Spreadsheet via an API call.

However, when you actually get the data, the JSON isn’t really in the kind of structure you would imagine. Instead of a matrix of rows and columns, Google returns an RSS-style linear feed of “entries” for all of the cells!

So how to convert that into something that you can use in D3.js or R?

We need to iterate over each entry in the feed, and push the values into an array, moving to a new “line” in the array each time we get to a cell that is at the beginning of a row in the spreadsheet. I’ve written a JavaScript function to do the work necessary; you can get the code on Github.

Running this function we can then get the values from the resulting array using something like:

data[1][5]

Note that the function doesn’t differentiate the labels from a header row (which is something you’d commonly see, and which R would usually expect) so there is definitely room for improvement in the function.

Posted in Data modelling and migration | Comments Off on How to: convert Google Spreadsheet JSON data into a simple two-dimensional array