OUP Data Visualization Project

OUP Journals

OUP Journals

In coordination with IT Services and the Bodleian Libraries, this project will further the collaborations and services necessary to support researchers in publishing interactive visualizations of research data in OUP-published journals.

The project intends to: (a) identify between one and three Oxford-authored research articles that have been accepted for publication by OUP journals (b) liaise with the authors and Bodleian Libraries staff to host the underlying research dataset in an appropriate data repository (c) in coordination with Academic IT staff, provision the dataset through a third party data visualization service to create an engaging visualization, and (d) integrate the resulting interactive visualization alongside the published research articles on the OUP website.

The benefit to the reader is that it will allow them to manipulate and interact with “the data behind the graph,” increasing their engagement with, and understanding of, the published research.
For the author, it provides greater impact and educational value for their publication. The visualization will also be used to promote the author’s research through social media.

Data publication is considered to be the next frontier for research publishing. The benefit of this innovation project to researchers is that it allows both the Libraries and OUP to experiment in the publication of live and interactive research datasets.

OxRep Project

OxRep Project (click to vist interactive data visualization)

Finally, the project will include a legal, technical, and commercial evaluation of the proposed data publication and visualization infrastructure.

The proposal is a clear demonstration of OUP’s mission to “further excellence in research through publishing.” It positions both OUP and the University to integrate data visualization services with the publication of research datasets and to offer a more valuable publication service to OUP authors.

Posted in Data visualisation, Live data, Projects | Comments Off on OUP Data Visualization Project

3-month report: December to February 2016

Highlights

Writing home: how German immigrants found their place in the US

Writing home: how German immigrants found their place in the US

The Live Data project steering group are very happy with our progress and have asked us to run a larger event aimed at academics, publishers and the press where we will discuss the future of data publication and visualization. Martin Hadley also had our first research data visualization published in The Conversation – Writing home: how German immigrants found their place in the US. (The conversation team were unable to allow iframes so the visualization is a link rather than embedded as we’d hoped).

Suzy and Adelina

Suzy Shepherd and Adelina Tomova at work during their 2015 internship.

Martin Wynne is delivering Clarin project remaining tasks which will culminate with an event in Oxford titled “Exploring Spoken Word Data in Oral History Archives” which will draw researchers from across Europe.

James Cummings is coordinating DHOxSS 2016 with colleagues across IT services and academics in departments.

The Blender project has attracted more researchers than we planned which is helping us define how we’ll offer the service going forwards.

We’ve conducted a service review with Peggy McCready and agreed how our work fits with Research Services and the Bodleian Digital group.

Finally, some great news just in. Our 2015 summer intern Adelina Tomova has just been offered a job in New York. Adelina helped us create the OpenSpires website and led the production of the Openness at Oxford videos with Suzy Shepherd.

Progress against plans for last 3 months

Engagement statistics, December to February 2016

Engagement statistics, December to February 2016

  1. Projects:
    1. Live data: on track, the project steering group has asked us to expand scope of the SIG meetings to include Publishers and Press. We are aiming to organize a meeting
    2. Participant Data: delayed whilst James Cummings takes over from James Wilson
    3. DMT project support: delayed whilst funder reviews project plan
    4. Blender 3D: on track, event now merged with Live Data sig to expand potential audience
    5. Clarin projects: on track, project will finish end of April with an event in Oxford.
  2. We’ve continued to expand our teaching, and we are finding ways to join the teaching together as a curriculum themed along the lines of ‘data science practical skills’. We are also offering to teach out in departments more often.
  3. We need to do more to package up our teaching for departments and advertise via websites such as the RDO
  4. RDM delivery group agreed communication plan, now we have to implement it.
  5. Scott Wilson and Kris Popat have released ORDS 2 which we hope to have on Oxford servers soon. This implements APIs that return JSON. We will try to demonstrate how the Drupal DataTables module can be setup to pull data from ORDS to be displayed in an interactive table – see datatable examples here.
  6. The main task we need to do soon is to contact the DCC and ask who at Oxford is using the DMP Online tool

Plans for next 3 months

  1. With James Wilson leaving we will need to ensure we can take over the work he owns i.e. ORDS service management, Participant Data project and all the support requests he owns. This will be tough as we currently don’t have extra resources.
  2. Continue to deliver the projects pipeline (as above) but also agree new projects for next year
  3. Plan and deliver two new outreach events aimed at researchers at Oxford – the data visualization event with OUP and Social Sciences, and event organised with Learning Institute
  4. Get the RDM communication plan moving and organise the next delivery group meeting focused on projects
  5. Deliver the Participant Data report, and plan SIG meeting and survey
  6. Write project request focused on electronic laboratory notebooks
Posted in Reports | Comments Off on 3-month report: December to February 2016

Reflections on the 11th Digital Curation Conference

Last week Martin Hadley attended the 11th International Digital Curation Conference in Amsterdam which this year focused on “visible data, invisible infrastructure” to present on the ACIT team’s work on supporting researchers in creating interactive visualisations through the Live Data Project.

Badges Encourage Open Data

Slide from Andrew Sallans’ talk on osf.io – http://www.dcc.ac.uk/webfm_send/2159

In our paper we posited that Open Access and Open Data are necessary but not sufficient for visible and easily discoverable research; interactive visualisations provide a fundamental bridge between researcher, publication and data that can be easily consumed by both an expert and generalist audience. We were fascinated by Andrew Sallans from the Open Science Framework talk in which he made the point that “making behaviours visible promotes adoption [of Open Access]” – since integrating “badges” and other reward-like metrics into osf.io the number of articles with Open Data has more than tripled.

It was fascinating to discover more services like osf.io, figshare and Dyrad and their approaches to promoting visible research. We were pleased to announce at the conference that the ORDS Open Source project has just implemented a RESTful API that will allow data to be pulled directly from live research databases for analysis or visualisation, and that this will be available in the Oxford ORDS instance soon.

The opening conference keynote by Barend Mons on “Science as a Social Machine” began the conference with a forward-looking but potentially controversial tone. Bernard highlighted the complexity of Open Data by including a photo of Tim Norris’ poster competition winning entry – the “data curation mountain” – and the dangers of assuming a Data Management Plan is sufficient to ensure far-future accessible data, instead preferring “Data Stewardship Plans”. In his talk, Bernard introduced the European Open Science Cloud (“more a framework than a cloud, it’s not a cloud”) which seeks to find and implement innovative funding schemes, funding and recognition practices to enable the data expertise that Europe needs in the coming decades. ACIT will be actively following this project as we develop a data science support service catalog.

During the 3 day conference we learnt from a wide range of different institutions and libraries about their approaches to RDM Support, and we’re very gratified there was so much interest in interactive data visualisation that our proposed Birds of a Feather session was chaired and led to a number of interesting conversations and potential collaborations. Reproducibility was an under-represented topic at the conference, however it was very interesting to meet Florio O. Arguillas and discuss Cornell’s Compregensive Extensible Data Documentation and Access Repository (CED2AR) and Code Replication Service which was detailed in a conference poster. ACIT at Oxford does not currently provide a service similar to CISER’s Replication Service but is looking forward to future discussions on how we can learn and potentially partner with Cornell to provide a similar service.

Posted in Events, Live data | Comments Off on Reflections on the 11th Digital Curation Conference

Live Data Project – First Project Board Meeting

We were pleased to receive comments and feedback from the first Live Data steering group on 21st January on the case studies we currently have in development, as well as our future plans. This blogpost is a short summary of current progress in the Live Data project and points of note from the meeting.

Progress

There are currently four case studies in the final stages of development, covering the Humanities, Social and Biological sciences. We are looking to recruit more case studies in mid-February; researchers interested in creating interactive visualisations should contact martin.hadley@it.ox.ac.uk.

The two case studies closest to completion have provided excellent opportunities to create template Shiny apps for interactive network and geographic analysis – these will be made available in the near future via the project website and Github.

We’re pleased to announce our pilot Drupal site now supports the embedding of iframes and will soon be populated with case studies and other demonstration visualisations from the project.

What’s in a name?

We are in the final stages of selecting the name for our visualisation service, the Live Data monicker is useful within the research facilitator/knowledge exchange networks but does not make clear to researchers that we are here as a resource to support a service.

Questions about our chosen visualisation services

The following considerations were highlighted as being concerns by the steering group:

  • Researchers need to understand the licenses attached to their visualisations on the cloud-based services we’re using, particularly in the case of Tableau Public that attaches a highly pervasive license
  • Backwards compatibility and version control options for visualisation services must be made clear to researchers before recommending solutions
  • The capability to print visualisations is extremely important to many researchers and the options available should be made clear in our training materials.

Alliances with other groups

There is some skepticism from a few researchers about the utility of interactive visualisations, that they detract or misrepresent research data – particularly with regard to how uncertainty is communication in charts and graphics. To assist in heading these concerns head on we are building stronger alliances with the following groups at Oxford:

  • Oxford’s Research Software Developer Network
  • Oxford’s Research Facilitator Network
  • Oxford’s Knowledge Exchange Network

Noting that during 2016 the latter two networks are merging, providing an excellent opportunity to include the Live Data project in cross-channel messaging opportunities to introduce the new network.

Future Networking/Presentation Events

The first Live Data Networking event in November was a run away success with standing room only, it was great to hear about the vast range of visualisation tools developed by researchers here at Oxford. For future events we would like to attract researchers who would like to visualise their own data, particularly those who have never considered visualisations as a communication means before.

To that end, our next event will be focused on interactive visualisations in the academic publishing world – what opportunities do publishers and the press provide to researchers and how best to take advantage of them.

Other developments

Open Data and Open Access continue to be hot topics in academia, the research councils and funding bodies across the world. The newly established Centre for Digital Scholarship in the Weston Library aims to facilitate the transformation of scholarly practice across the University of Oxford.

Posted in Live data, Projects | Comments Off on Live Data Project – First Project Board Meeting

Exploring Online Language Resources

A course in the IT Learning Programme at the University of Oxford in Hilary Term 2016 will explore how we can use online language datasets to explore language, history and culture. This course is the latest stage in the evolution of the ‘Corpus Linguistics’ course which has run for the past few years.

We now have at our fingertips huge amounts of language data in digital form, representing unprecedented opportunities for exploring and analysing language and discourse. How we can use the evidence of language usage in digital resources to draw conclusions about language, culture and society? Drawing on techniques and methods from corpus linguistics, this course will offer guidance on finding and evaluating digital sources, hands-on exercises to explore and analyse data, and some suggestions on how to assess, use and interpret evidence from digital sources.

Each session will focus on the exploration and analysis of a different corpus or dataset, with practical hands-on exercises for how to use the resource to find evidence to explore linguistic, socio-cultural and historical research questions. Participants are free to attend the whole course or individual sessions, although there will be benefits, to beginners in particular, to attend the whole course and build week by week on the techniques and insights offered by each session. Prior registration with the online services described below will save time on the day.

1. BNCWeb – exploring a corpus of late twentieth century English

12:30-13:30 Thursday 28th January (HT week 2) at IT Services, Banbury Road. Sign for free to attend the course here.

The British National Corpus is a very widely used and cited dataset, which was designed and built in the 1990s to provide a representative and balanced sample of modern British English, in speech and writing, across a number of varieties in a wide range of contexts. This session will introduce and explore basic concepts of corpus design and construction, and introduce techniques, functions and methods for corpus analysis. BNCWeb is a customized application of CQPweb, with the facilities to exploit and analyse the linguistic annotation of the texts in the BNC, and to make use of the detailed descriptions of the sources. Participants can access BNCWeb with Oxford single sign-on via a link at https://ota.oerc.ox.ac.uk/ (and can also register to use the BNCWeb service hosted at Lancaster University, which will be the back-up in case of problems with BNCWeb at Oxford).

2. CQPweb – exploring a range of corpora

12:30-13:30 Thursday 4th February (HT week 3) at IT Services, Banbury Road.  Sign for free to attend the course here.

The online application CQPweb offers an interface to a powerful corpus search and analysis engine which can be applied to any textual dataset. CQPweb is an open source software application, deployed at many institutions around the world to offer access to a wide range of corpora. This session will focus on mining a large corpus from Early English Books Online for historical information. Participants should register to use the service at http://cqpweb.lancs.ac.uk/.

3. corpus.byu.bnc – historical and cultural investigations

12:30-13:30 Thursday 11th February (HT week 4) at IT Services, Banbury Road.  Sign for free to attend the course here.

The set of large corpora hosted at Brigham Young University include contemporary and historical Corpora of British and American English, Spanish, Portuguese, and the Hansard Corpus of UK parliamentary proceedings. This session will further extend the exploration beyond linguistic research questions to explore historical and political texts. Participants should register to use the service at http://corpus.byu.edu/.

4. The Oxford English Corpus – lexicography and beyond

12:30-13:30 Thursday 18th February (HT week 5) at IT Services, Banbury Road.  Sign for free to attend the course here.

The Oxford English Corpus, and related datasets, offer the opportunity to  explore current and recent trends in the English language, via a very large and growing corpus which is regularly updated with new texts. This corpus is used by the lexicographers at Oxford University Press to create and update entries in the Oxford English Dictionary and other dictionaries, reference works and teaching materials, and can also be used to monitor and discover social trends via the discourses revealed in the data. The Oxford English Corpus uses the SketchEngine software to manage, filter and reveal patterns in these multi-billion word corpora. Log-in credentials for the Oxford English Corpus are kindly supplied by OUP and will be issued during the tutorial session.

5. Exploring modern European languages with CLARIN

12:30-13:30 Thursday 25th February (HT week 6) at IT Services, Banbury Road.  Sign for free to attend the course here.

A wealth of corpora and other language resources are becoming more easily available to researchers thanks to the CLARIN European Research Infrastructure Consortium. The UK has recently joined CLARIN as an Observer, allowing access to all UK researchers with institutional single sign-on via the UK Federation. We’ll take a whistle-stop tour of some of the available languages and corpora, with a focus on the facilty for Federated Content Search, finding hits for a search term across a wide number of resources held in different repositories. Access is available to all University of Oxford users, and via institutional single sign-on to users in higher education institutions from participating countries (see more about access at http://clarin.eu/content/easy-access-protected-resources).

The course will take place Thursday lunchtimes weeks 2-6, Hilary Term 2016, at IT Services, Banbury Road, and will be taught by Ylva Berglund Prytz and Martin Wynne of IT Services, University of Oxford. It is open to all members of the University of Oxford and there is no charge.

Posted in Digital Humanities, Events, Text encoding, analysis and digitization | Comments Off on Exploring Online Language Resources

3-month report: September to November 2015

Highlights

Projects and service development

RDM Oxford postcard

New Research Data Oxford postcard (click for larger image)

The University IT Innovation Challenges funded the Blender 3D project which is progressing well. The Project Manager Rowan Wilson has setup the software needed on the new hardware (dual titan CUDA capable GTX graphic card, 64GB RAM no less!) needed to develop the simulations. He has met with the two researchers identified in the project proposal (engineering and geography), and started discussions with other academics working in neuro-anatomy, humanities, oncology and robotics. A key aspect of the project is making it easy and quick to run short compute-intensive jobs on ARC e.g. rendering a 3D video of a Blender model constructed using a large dataset (e.g. Lidar, CT, fMRI and simulated data created using MatLab). Rowan will use the ITIL Service Design documentation to start describing the project deliverables as a sustainable service, focused on supporting researchers in preparing data by stepping through pre-defined data transformation workflows.

James Wilson and James Cummings are leading on the Participant Data project to write a detailed project plan (‘PID’) that will enhance the scope of the service we can offer academics with respect to managing data about people effectively and safely. There are a number of different options that we can take in terms of project scope and definition and we will discuss these with the project steering group to decide where to focus before taking the project to the Research IT board for funding.

Martin Hadley is leading the Live Data project. He organized a very successful first data visualization network event at OeRC, has started preparing the data science curriculum with Steve Albury in the ITLP team, has several academic case studies under development and hopes to have the showcase website up in January 2016. The main area we need to think carefully about on this project relates to license negotiations with the cloud service providers (Plot.ly, Tableau and Shiny) to ensure their data is safe. We’ll use the new cloud services toolkit (Oxford-only access) to make sure we follow best practice.

James and Meriel worked with library colleagues to enhance the Research Data Oxford site, to create new data management planning guidance customized for Oxford academics using the DMP Online tool, and also created new RDM postcards to advertise the RDM services we offer. We continue to refine the new ORDS services, working closely with colleagues across IT Services. We hope to make use of ORDS APIs soon to create data visualizations, and a browse/search functionality in the standardized Drupal instance being developed by Software Solutions.

Martin Wynne is delivering the final phases of the Clarin Eric and Plus project work. He will organize an event here in Oxford April 2016 and plan several similar events that promote EU corpus linguistic repository services. He will also deliver a number of written case studies that focus on specific repositories.

Ken Kahn continues to work with the oncology department to support their work using Agent-Based modelling to understand the role of gene interactions in cancer development. Ken is producing a new web service that outputs a simulation of the tumor and graphing of the tumor statistics to help with a new project grant application. The web service posts the model experiments to ARC which returns the data set for graphing and visualization. We may even be able to produce a 3d rendering of the data using Rowan’s expertise i.e. java script needed to make a WebGL animation.

James Cummings remains the Oxford Scientist in Charge for the ongoing DiXiT Project, a Marie Curie Initial Training Network, but his Experienced Researcher Magdalena Turska departs the Research Support Team as of the 30 November 2015.  She goes to work with the people from eXist Solutions, who are providing development and support for a number of Oxford projects using the eXist-db Native XML Database. James also continues to work with iSicily and LEAP projects. A recent SSHRC funding bid has been successful for more work with the REED project.

Teaching and events

All the team offered a wide range of taught courses to the ITLP programming: Introduction to ORDS, Research Data Management Planning, Exploring Online Language Resources (previously known as ‘corpus linguistics’), Blender, Copyright in the digital world, XML Editing: Basic XML editing with the oXygen XML Editor, XPath: Using XPath to search in the oXygen XML Editor, TEI Guidelines: An overview of the recommendations of the Text Encoding Initiative, XSLT: Transform your XML documents, and the 7 week ABM course.

Rowan has started a Policy Forum for members of the University to discuss and review current IT Services policies. Rowan will also lead a review of all current IT-related policies and report findings to the deputy CIO.

Martin Wynne and Rowan also worked with ITLP to organize another term of lunchtime courses delivered by academics focused on research data.

James Cummings has worked, as member of the Research Software Developers Network steering board, to help the RSDN have an ongoing programme of events around the university.

James Cummings continues as the founding Director of the Digital Humanities at Oxford Summer School (DHOxSS), one of the most important international training events in this field. Planning is well underway with the cross-divisional DHOxSS committee for DHOxSS 2016 which will run from the 4-8 July 2016.

Howard Noble, Lucie Burgess and Glenn Swafford have set up the RDM Delivery group. Key members of IT Services, Bodleian and Research Services staff will meet regularly to ensure the delivery of projects, infrastructure and client services, as well as RDM-related training and events. The first meeting focused on information sharing and resulted in the RDM Roadmap (Oxford-only access) which visualizes a project timeline, courses heat map and funding resources comparison chart. The second meeting will focus on RDM communications for 2016. The third will focus on new funded and business-as-usual projects.

Ken also hosted another local student, Patryk Golec as part of the STEM Ambassador programme. Patryk wrote a summary of his work experience.

Progress against plans for last 3 months

Engagement statistics, September to November 2015

Engagement statistics, September to November 2015

  1. The Live data, Participant data and Blender 3d projects are progressing as planned
  2. Our work with the Bodleian Digital Manuscripts Toolkit project team started 30th November 2015
  3. Howard is working with James Wilson, Meriel, Lucie Burgess, John Southall and other colleagues to organize the next RDM delivery group meeting on the 4th December 2015. We will work on a detailed RDM communications plan for 2016 focused on the services we can provide researchers throughout the RDM life-cycle
  4. We have agreed a detailed project plan for all the remaining Clarin work with OeRC and directors at Utrecht University
  5. Martin Hadley is working with Steve Albury and research colleagues to create a data science curriculum and courses that will start early 2016

Plans for next 3 months

  1. Continue to deliver the Live data, Participant Data, DMT, Blender 3D and Clarin projects as defined in the project plans
  2. Continue to offer our taught courses via ITLP
  3. Deliver the new data science courses and show how they fit to the overall RDM programme of work
  4. Continue to work with RDM delivery group colleagues to maintain and improve the RDM Roadmap, implement the RDM Communication Plan, drive forwards the improvement of current portfolio of infrastructure and client services
  5. Increase uptake of the ORDS service, and make use of the new ORDS APIs for visualization and in websites
  6. Work with Research Services and the Bodleian Libraries to deliver the Act on Acceptance campaign, increase uptake of Ora-Data, and roll out the new Oxford version of DMP Online
Posted in Reports | Comments Off on 3-month report: September to November 2015

Live Data Network Retrospective: 16th November

Live Data SiG Nov 16 Cartogram
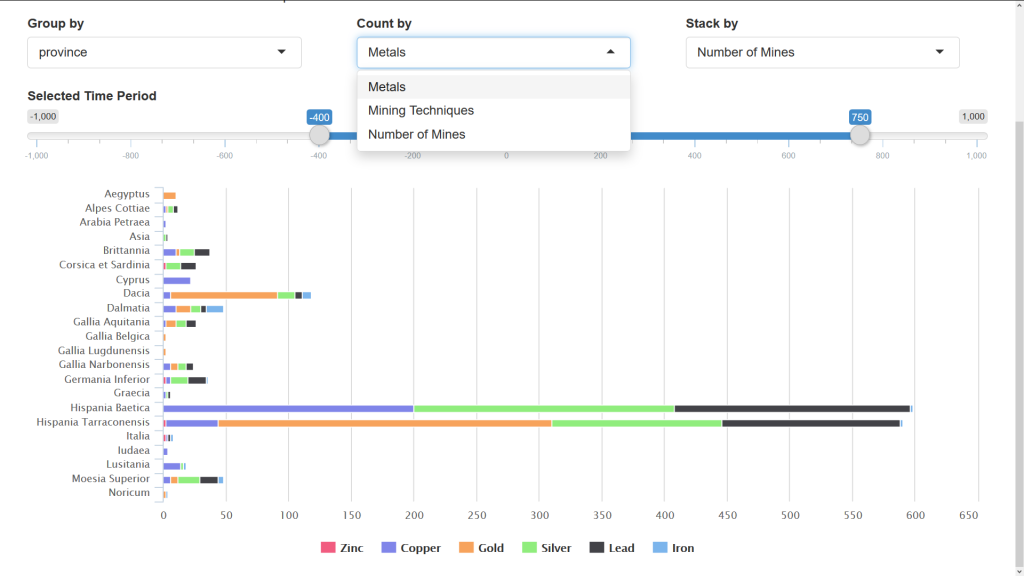
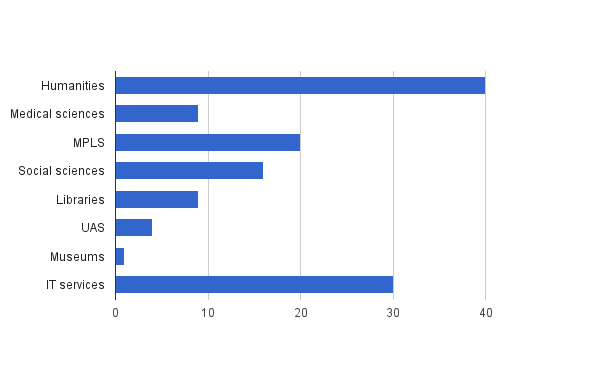
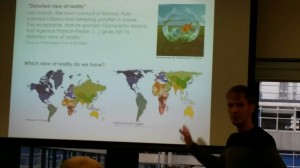
The first Live Data Network event was hosted by the OeRC on Monday 16th November with presentations from nine researchers from across the University and introduced by Professor of Visualisation, Min Chen. An enthusiastic audience of 27 brought the room over capacity, evidence of the wide interest in building interactive visualisations at the University.

Talks were invited from researchers with existing visualisations or datasets they would like to visualise, and from the developers of specialist visualisation tools built here at Oxford.

  • Dr. Alexandre Tessier (visiting the Faculty of History) discussed his study of Early-Modern European Mail services and his interest in visualising how the network developed and changed across the three centuries in his field of study. This project is part of the Cultures of Knowledge program.
  • Marilou Polymeropoulou (Faculty of Music) presented on using networks and social network analysis (SNA) as a method for visualising data in the social sciences and humanities with amusing clips from the Europe in 8bits documentary accompanying her work on visualising the ethnography of 8bit music across the world.
  • Rowan Wilson (IT Services) has a project to visualise data using Blender 3D and demonstrated the capabilities of Blender for photo-realistic rendering, rigging and animation.
  • William Allen (Migration Observatory) provided an overview of how the Migration Observatory has used interactive visualisations to give the public a window into the 2011 Census.
  • Daniel Haley (Materials Science) demonstrated the fascinating 3Depict software for visualising 3D point clouds, with integrated visualisations for charge/mass and spectroscopy data.
  • Benjamin Hennig (Geography) is pictured top-right discussing his work with cartograms on http://worldmapper.org and http://londonmapper.org
  • Ben Jeffery (Wellcome Trust Centre) works on the impressive Panoptes tool for exploring and visualising research data, with a particular focus on genomic data.
  • Stephen Taylor (Computational Biology) gave an excellent overview of the Oxford developed Zegami tool for image collection categorisation with integrated analysis and visualisation tools.
  • Andrew Stretton (ChemBioHub) is the web developer for ChemBioHub, building a platform for researchers to organise and collaborate on chemical biology research with built-in visualisation.

Note: In the interest of openness, Martin Hadley’s introductory presentation and the results of the cake survey are available through this Shiny app, https://martinjhnhadley.shinyapps.io/LiveDataSiG16thNov

Cake preference chart

Cake preferences for the Live Data SiG held on 16th November

Posted in Data visualisation, Events, Live data | Comments Off on Live Data Network Retrospective: 16th November

First Live Data Network Event on 16th November

In just less than a fortnight we’re hosting the first termly meeting for researchers interested in interactively visualising their data to meet and discuss ideas; everyone (undergraduate, postgraduate, research fellow and academic staff) is invited to attend.

Date: Monday 16th November
Time: 2:00pm – 4:00pm
Refreshments: Coffee and cake
Venue: OeRC Conference Room, OeRC, 7 Keble Rd, Oxford OX1 3QG

These meetings support the Live Data Project which has the goal of “making visualisation a service” to researchers at the University by promoting the use of interactive visualisation technology and developing training courses in a variety of software packages and programming languages. The project was inspired by the growing numbers of researchers at the university with an interest in either visualising their data or building software for visualising their collaborator’s data. One of the problems we’ve found is that researchers are often interested in similar problems and data visualisation tools, but unaware of one another. We hope that through these meetings we can connect researchers across all the University divisions and foster a collaborative community of researchers building interactive visualisations.

Each meeting we’ll invite two types of talks, and in the future will invite external speakers to discuss their experience in creating interactive visualisations:

  • 10min presentations on example interactive visualisations
  • 5min presentations on datasets that they’d like advice in visualising

There are already a number of presentations lined up on Blender 3D, visualising and analysing music preference networks, and more. If you’re interested in giving a presentation, attending or just to find out more then please email martin.hadley@it.ox.ac.uk

Posted in Data visualisation, Events, Projects | Comments Off on First Live Data Network Event on 16th November

EPSRC Readiness Project – Summary

By James AJ Wilson 

The ESPRC Readiness Project was undertaken to raise awareness amongst EPSRC-funded researchers of the new research data management Expectations that the Engineering and Physical Sciences Funding Council introduced on the 1st May 2015 (https://www.epsrc.ac.uk/about/standards/researchdata/expectations/). The nine Expectations oblige researchers to document, preserve, and provide access to the research data that they create, and require research institutions to provide the services and support needed to ensure this can happen. Rather than simply asking researchers to comply with the new Expectations, the project sought to understand researchers’ concerns, and to improve the guidance and support offered by the University of Oxford.

More than a hundred EPSRC grant-holders were sent a letter signed by the Pro-Vice-Chancellor for Research (Professor Ian Walmsley) informing them of the new Expectations and inviting them to meet with a member of the EPRSC Readiness Project Team. Over the coming months, the large majority of those invited participated either in a one-to-one meeting or a disciplinary workshop.

Reactions to the EPSRC Expectations expressed during the interview and group sessions were mixed, but generally negative. Many researchers felt that the Expectations would add to their already busy workloads and be of little value either to themselves or their wider disciplinary communities. Even when informed of the kinds of benefits the EPSRC envisaged arising from the Expectations, a degree of scepticism remained. The Expectations were, however, greeted more positively by researchers working in the fields of crystallography and aspects of biochemistry, where it is already common practice to share data and where the infrastructure to assist with this is already established at the disciplinary level. It will inevitably take time for all of the new data management requirements to become generally accepted practice in many disciplines, but responses also suggested that barriers to acceptance can be greatly lowered by the provision of simple, integrated, and easy-to-use tools and services by the institution.

Throughout the project, researchers sought clarification as to how the EPSRC Expectations would affect them in practice and what they needed to do to ensure compliance. These questions were addressed and added to a FAQ on Oxford’s Research Data website (http://researchdata.ox.ac.uk/epsrc-data-requirements-and-what-you-need-to-do/). A checklist and decision tree where also developed.

Particular concerns included: what actually counts as data?; what should be done with the software underpinning datasets?; whether preference should be given to preserving raw or processed data; whether the effort required to intelligently share research data was worth it for some data types; and how the expectations applied to largely theoretical research outputs. The concerns raised by researchers have been relayed to the EPSRC.

A number of suggestions as to how University support could be improved were noted down and are now being acted upon. These have proved particularly important for understanding how researchers need to interact with the University’s data repository, ORA-Data (http://www.bodleian.ox.ac.uk/bdlss/digital-services/data-archiving). As a result of the project, the data deposit workflow has been significantly improved, and the pricing model for the service is being reviewed.

EPSRC-sponsored researchers are now leading the field in terms of the number of data deposits they are making to the ORA-Data repository, suggesting that the project has indeed been successful in conveying the Expectations.

Posted in Projects | Comments Off on EPSRC Readiness Project – Summary

3-month report: June to August 2015

Highlights

Martin Haldley profile

Martin Hadley profile

We’re very pleased to welcome Martin Hadley to the research support team. Martin will focus on supporting academics in using a variety of tools for preparing and sharing data sets, and in particular academics interested in using data visualization to connect with potential collaborators, and engage the public in research.

DHOxSS 2015 was a great success, and coped well with the increased numbers. The DHOxSS is a collaboration between various units of the University of Oxford donating their time as DHOxSS Directors, Organisational Committee, Workshop Organisers, Speakers, and in the work of the IT Services Events Team. Speakers and Workshop Organisers are rewarded for their labours through attendance at the DHOxSS welcome reception and sometimes other events. The enterprise as a whole is financially underwritten by IT Services. For more information see the Digital Humanities website or a blog post report by Dr James Cummings.

Adelina Tomovo, Suzy Shepherd and Rowan completed our latest set of videos for the openness at Oxford series on podcasts.ox.ac.uk. These videos are particularly impressive in terms of production values, and the academics involved: Ben Goldacre, Danny Dorling, Chris Lintott, Maja Založnik, Jacob Dahl, Viktor Mayer-Schönberger and Antoine Jerusalem to name just a few. The videos present an upbeat but realistic view on research data management and the challenges ahead.

The Live Data, Participant Data and Blender 3D project funding requests have all been approved for funding and will start September/October 2015.

James Wilson completed the EPSRC readiness report which is looking at ways to support academics who need to manage research data.

Rowan Wilson completed the lecture capture report which will be used to inform decisions relating to procurement of ‘cloud’ storage for recorded lecture recordings.

Martin Wynne completed the first phase of the WebCMS project (looking to create a service for members of the University to create websites using pre-defined templates using Drupal). We are now waiting to see what is proposed for the next phase.

We continue to support the Science Oxford STEM Ambassadors scheme by offering work experience to local GCSE students. We hosted Lukas Kaczkowski from St Gregory the Great, John Kafke from the Cheney School and John Albury from Deer Park school in Cirencester.

Progress against plans for last 3 months

ngagement statistics, June to August 2015

Engagement statistics, June to August 2015

  1. We met our budget target for 2014-15 and have a healthy pipeline of work for the coming year
  2. The ORDS software has been handed over to the Software Solutions service team and has 20+ academic projects on the go
  3. Martin completed his Clarin Eric and OeRC related work for 2015
  4. Rowan, Adelina and Suzy updated our openness series of videos on podcasts.ox.ac.uk
  5. Martin Hadley has been inducted, (or is it induced?)
  6. We’re helping to form the RDM delivery group which will bring together Research Services, Bodleian and IT services staff
  7. We seem more relaxed after some holiday

Plans for next 3 months

  1. Start the Live data, Participant data and Blender 3d projects
  2. Start working with the Bodleian Digital Manuscripts Toolkit project which is in turn part of the Mellon funded International Image Interoperability Framework: http://iiif.io/
  3. Run the RDM delivery group meetings with teams at Research Services and the Bodleian Libraries i.e. maintain the RDM roadmap and producing a report for the RDM working group each term
  4. Agree next phase of Clarin work with OeRC and PIs in Utrecht
  5. Work with the ITLP to create a data science / RDM series of taught courses focused on tools and techniques for tidying, analysing, sharing and preserving data.
Posted in Reports | Comments Off on 3-month report: June to August 2015