I thought this pie chart of browser accesses to WebLearn may pique interest – for “Safari” read “Safari / Chrome”! This is from the period 1st August 2010 to 31 July 2011.
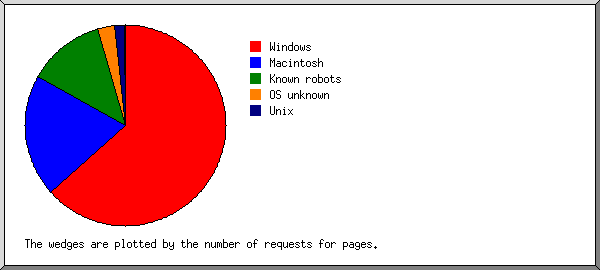
Here’s a similar chart for operating systems.
I thought this pie chart of browser accesses to WebLearn may pique interest – for “Safari” read “Safari / Chrome”! This is from the period 1st August 2010 to 31 July 2011.
Here’s a similar chart for operating systems.
Comments are closed.
The views expressed on this blog are mine and not necessarily those of the University of Oxford IT Services.

