I thought it would be useful to present some of the WebLearn usage figures that we used to supply for the annual report. Many apologies for the missing unique visitors data.
| 2012/13 | 2013/14 | 2014/15 | 2015/16 | 2016/17 | 2017/18 | |
|---|---|---|---|---|---|---|
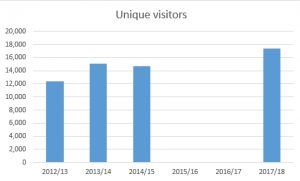
| Unique visitors | 12,385 | 15,108 | 14,685 | 17,421 | ||
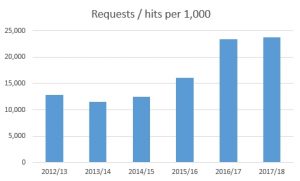
| Requests / hits per 1,000 | 12,846 | 11,449 | 12,484 | 16,049 | 23,418 | 23,776 |
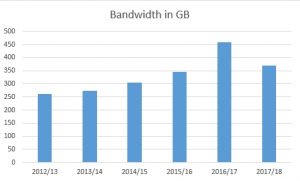
| Bandwidth in GB | 260.27 | 273.93 | 305.36 | 346.91 | 459.39 | 370.62 |
| Pages served | 338,738 | 316,537 | 427,600 | 695,360 | 7,127,123 | 572,980 |
The number of unique visitors over the first week of Trinity Term
The number of user requests is slightly up compared to last year:
However, the total amount of data transferred has decreased slightly: