As there was no IT Services Annual Report this year, I thought it would be useful to present some of the WebLearn usage figures that we usually supply.
| 2010/11 | 2011/12 | 2012/13 | 2013/14 | 2014/15 | |
|---|---|---|---|---|---|
| Unique visitors | 7,387 | 10,054 | 12,385 | 15,108 | 14,685 |
| Requests / hits per 1,000 | 7,166 | 11,584 | 12,846 | 11,449 | 12,484 |
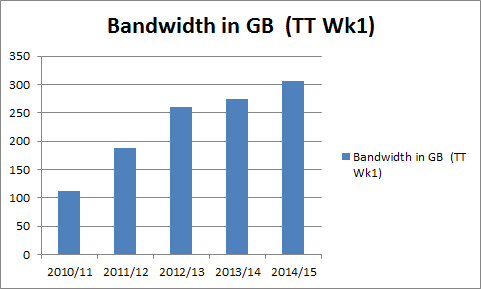
| Bandwidth in GB | 111.32 | 187.44 | 260.27 | 273.93 | 305.36 |
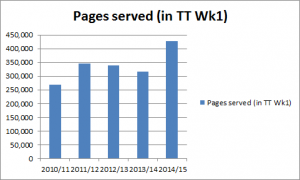
| Pages served | 268,511* | 346,785* | 338,738 | 316,537 | 427,600 |
The figures in the ‘Pages Served’ row for 2010/11 and 2011/12 (marked with a star *) include pages in old WebLearn which have inflated the count somewhat.
The number of unique visitors over the first week of Trinity Term is slightly down compared to last year.
 Conversely, the number of page served has risen significantly since last year.
 In line with the increase number of pages served, the total amount of data transferred has also risen.